Benchmark
![]()
Benchmark |
|
|
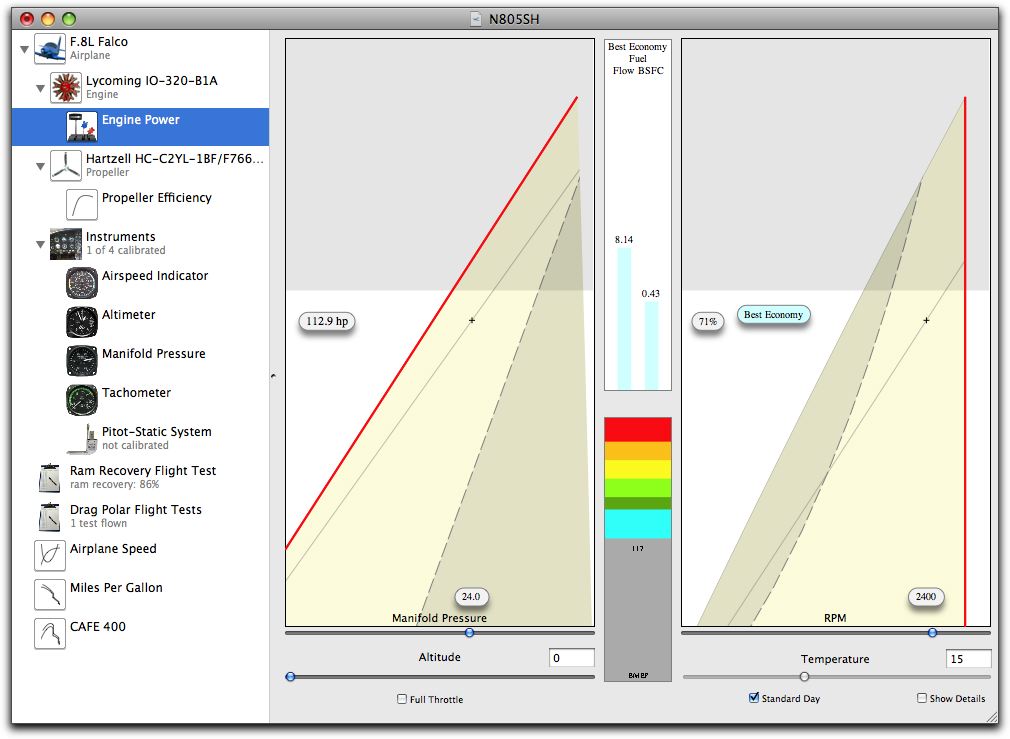
With the engine modeled, you can use the Engine Power Calculator to calculate the power and fuel flow of the engine. This is a radical departure from the traditional sea level / altitude performance charts in that it is dynamic and changes with any change in the altitude. There are two charts, power vs manifold pressure and power vs rpm. The Show Details option lets you choose whether you see all of the details or a simplified and more elegant presentation. The BMEP ranges are colorized to make some sense of the number ranges for anyone not intimately familiar with what the numbers mean. The two green ranges are for the normal BMEPs seen in straight- and angle-valve Lycoming engines, while yellow, orange and red are for exceptional, racing engines. BMEP is a 'bullshit alert' for outrageous engine power claims. This part of Benchmark clearly needs more work to show the information graphically. It's very easy to create an engineer's tool that shows the user a lot of numbers, but I want to create a display that make the whole thing understandable and clear, both to the novice and the expert. |
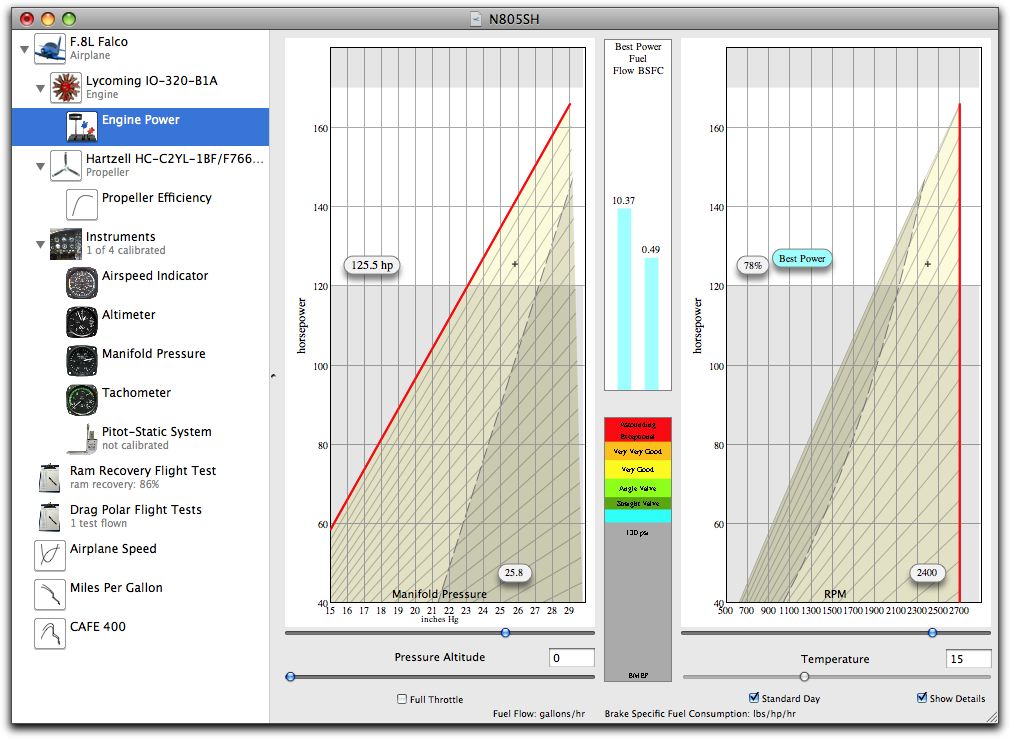
Here is the chart for a higher altitude and with Show Details selected. The calculator reports whether the fuel flow is for Best Economy, Best Power or Full Rich, as appropriate, and transparent gray fill is used to show the range. I'm indebted to Jack Kane for his excellent website presentation as well as his help for me. Brake Mean Effective Pressure Brake Mean Effective Pressure (BMEP) is another very effective yardstick for comparing the performance of one engine to another, and for evaluating the reasonableness of performance claims or requirements. The definition of BMEP is: the average (mean) pressure which, if imposed on the pistons uniformly from the top to the bottom of each power stroke, would produce the measured (brake) power output. Note that BMEP is purely theoretical and has nothing to do with actual cylinder pressures. It is simply an effective comparison tool. Based on my discussions with Jack, I have produced a color-coding to the bar chart with the following descriptions for normally-aspirated four-stroke engines, and for such engines BEMP is calculated simply: 150.8 x torque / displacement (in cubic inches). Range 0 to 80 is dark blue. 80 is for a 1940s flat-head Ford. Range 80 to 100 is medium blue. Maybe we should call this range "old automobile" Range 100 to 140 is light blue. Maybe we should call this range "automobile" Range 140 to 150 is dark green. This is the range of straight-valve Lycoming engines (150 and 180 hp O-320 and O-360) Range 150 to 165 is light green. This is the range of angle-valve Lycoming engines (200 hp IO-360 and 300 hp IO-540) Range 165 to 180 is yellow. "Very Good" Range 180 to 195 is orange. "Very Very Good" Range 195 - 210 is red. "Exceptional" Range 210 and above is also red. "Astounding" I am looking for ways of avoiding the use of words in this display, so for now, I will just stick with the color coding. From Robert Cumberford "BMEP - Bullshit Macho Exaggeration of Power" Brake Specific Fuel Consumption He adds that full power BSFC below 0.45 is exceptional. Part throttle BSFC can be in the 0.35 neighborhood. Diesel full power BSFC can be in the 0.35 neighborhood, too. |
![]()
![]()
|
|