Benchmark
![]()
Benchmark |
|
Entering Engine Power Data
You need to know the power that the engine is putting out at each power setting. This information is very important, To model the engine power, Benchmark uses three curves which you fit to the data of the engine performance. Engine manufacturers publish sea level and altitude performance charts. We’re only interested in the sea level portion, |
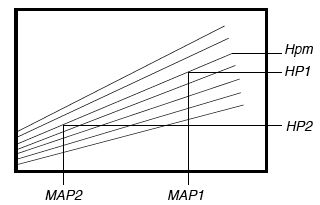
For each diagonal line representing a constant rpm, carefully note the power (HP1 and HP2 in horsepower or kilowatts) and manifold pressure (MAP1 and MAP2 in inches of mercury or Bar) at two points. Because Benchmark will be analyzing the slope of the lines, it is desirable to use two points that are far apart—normally the lowest and highest readable points for each rpm. You also need to note the maximum power available (HPm) for each rpm. For normally aspirated engines, the curved Here is the method that I have used to get the engine power chart information into Benchmark: |
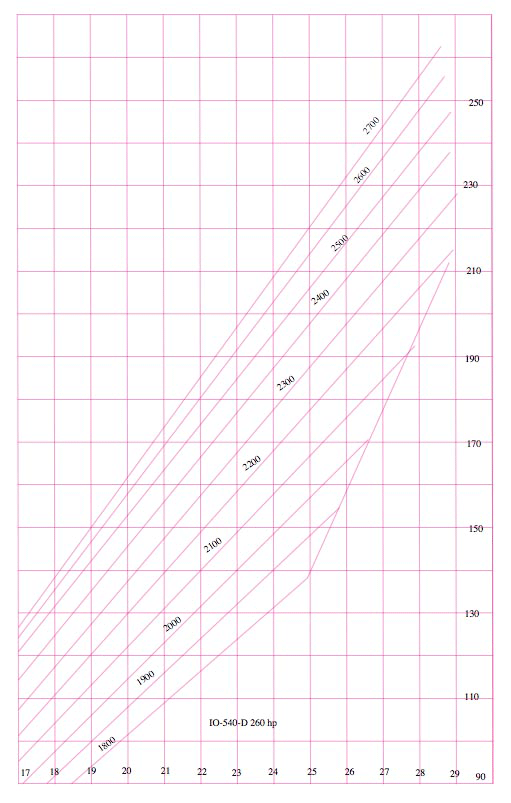
I scanned the engine power chart at 300 dpi. I imported this into PowerCADD. I drew horizontal and vertical grid lines on top of the chart, beginning with lines at the left, right, top and bottom of the chart, then created evenly spaced lines between them with the Linear Distribute tool of WildTools. I traced power lines as shown above, put in text objects to identify the grid lines. I moved the text objects within the rectangular boundaries of the chart and created a single group. I scaled this group and changed the drawing scale of the drawing so that the horizontal grid lines were spaced exactly one inch apart, vertically. |
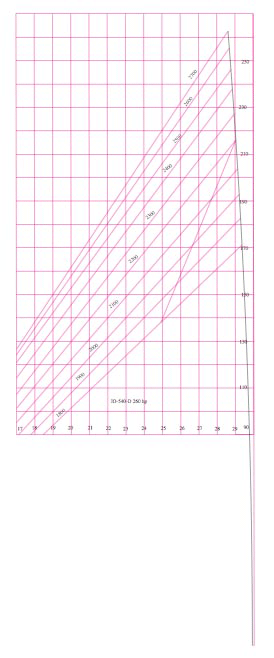
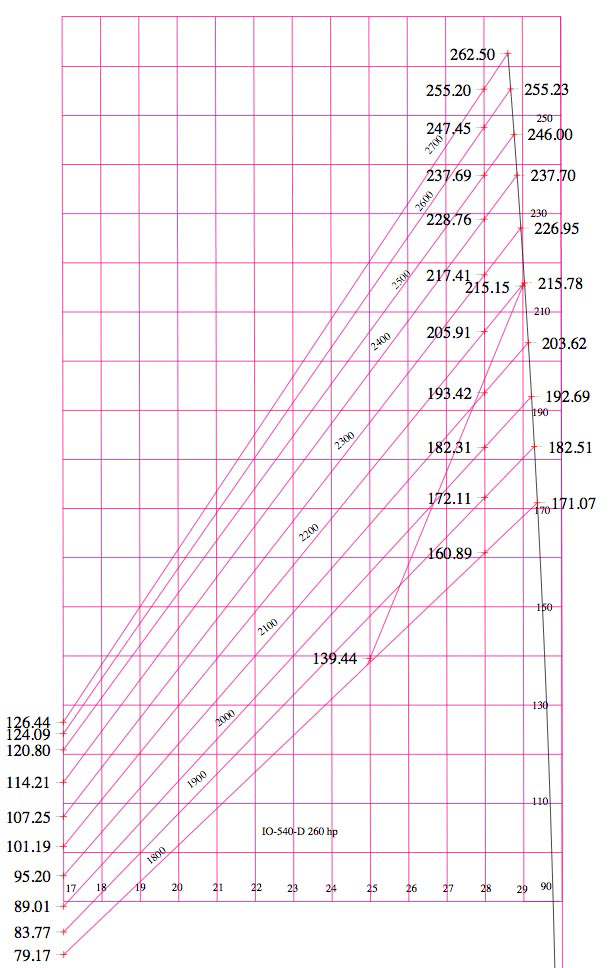
I drew a horizontal line at the bottom of the chart, between 29 and 30, then changed the length by multiplying it by 0.92. This is to get a point for sea level pressure: 29.92 inches HG. I created a zero power point below the chart, at 29.92 inches HG. I reset the origin of the drawing to this point. I created a simple tool in PowerCADD to draw a curve where the horizontal displacement increases as the square. This is to reproduce the curve that the maximum manifold pressure would make if it decreases with the square of the rpm. While this is a nice touch, it's really not necessary at all, and you could use a straight line or another type of curve since you will be changing these power data points anyway. This just gives you a logical starting place. |
![]()
|
|