Performance Testing 101
![]()
Performance Testing 101 |
|
The Drag Polar Test In order to get these numbers, you fly the airplane at the full range of speeds, from very slow to very fast. What you really want to know is the coefficient of drag and coefficient of lift at each speed, so not only do you need to know the speed at each point in the test, you also need to know the weight of the airplane at that moment. In a typical drag polar test, you and your data-recording 'flight engineer' fly the airplane at a single altitude, say 6000 feet, set the propeller rpm to maximum rpm and never touch it, and then change the power settings with the throttle. At each point, you must lean to best power, and you must let the airplane settle down. You write down a lot of numbers and then you enter these numbers into Benchmark and crunch them. At each point in the test, you must calculate the coefficient of lift and the coefficient of drag, and then by plotting all these on a chart you can determine the Cdo and Oswald E. Curt LoPresti says this process used to take him a half day when he worked at Mooney; Benchmark does it in a few milli-seconds. |
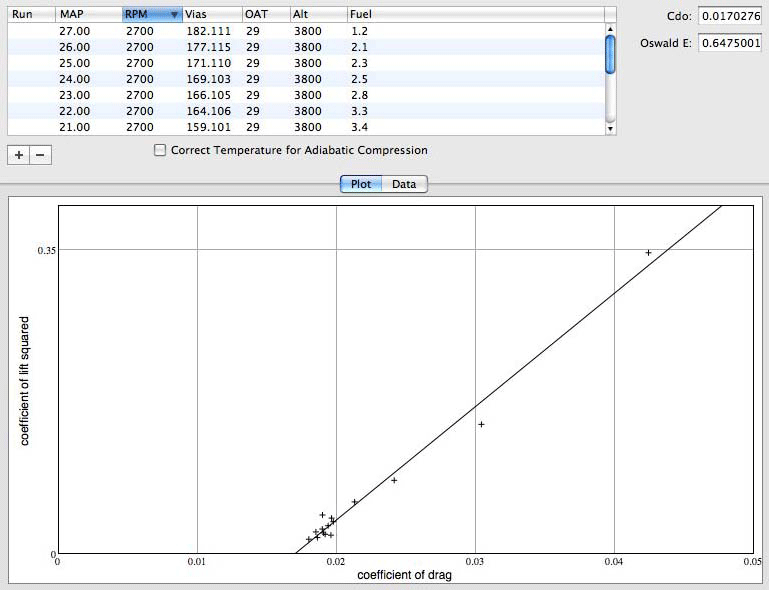
Analyzing a drag polar flight test produces this chart and the two 'magic numbers', the Cdo and Oswald E. Once you've got an airplane by its Oswald E and Cdo, you can predict its performance at any altitude, temperature, weight and power setting. Benchmark has a speed calculator which plots power required against power available, and shows not only the speed of the plane in level flight but also the maximum excess horsepower at the best climb speed, and it translates this to the climb rate in feet per minute. |
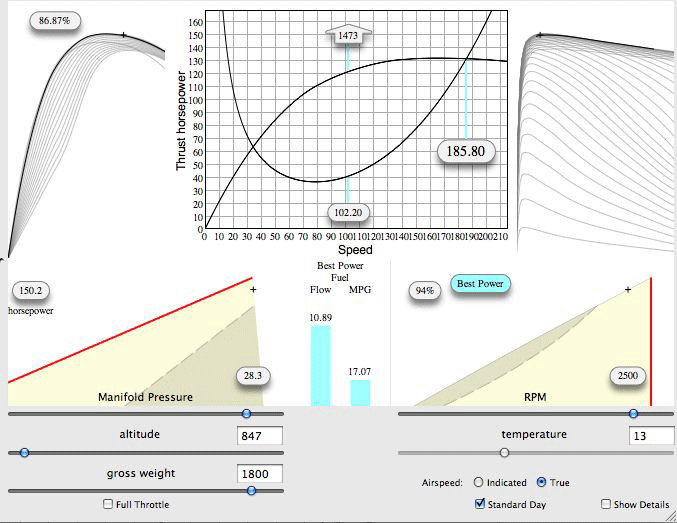
The airspeed calculator shows curves for power required and power
available. This rate of climb is slightly optimistic because in an actual climb the wing is flying slowly through the air and the fuselage is bathed in higher speed air from the propeller. This can be determined by doing a series of 'saw-tooth climb tests' to determine actual climb performance vs that predicted by excess horsepower. I've not yet put that capability into Benchmark because I've never had an engineer give me an equation for the relationship. Instead, everyone seems to talk in terms of tacking a few points onto the Cdo as an educated fudge factor. The Miles-Per-Gallon Chart |
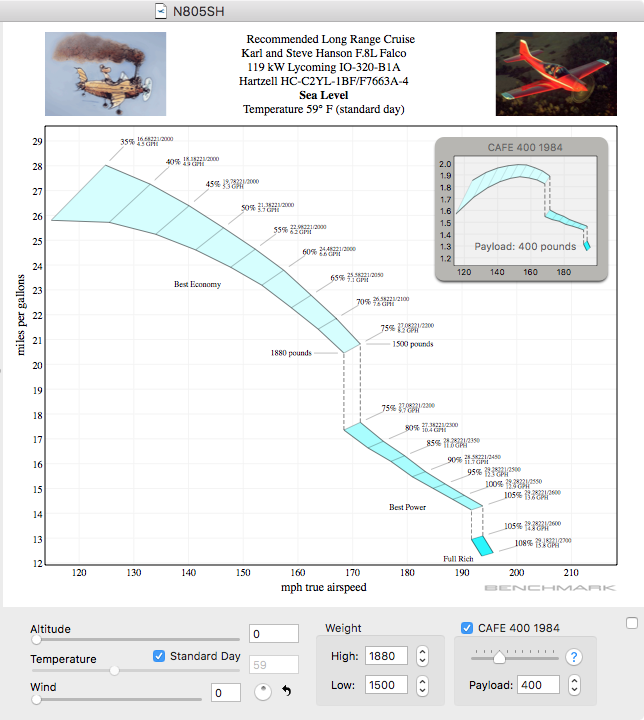
Here's the way the miles-per-gallon chart looks on the screen. To calculate the chart, Benchmark does an enormous series of calculations. Benchmark begins with full throttle and maximum engine rpm for the first calculation, and then steps down to 35% power in 5% intervals. In each case, it starts at the minimum rpm and increases the rpm as required to get the desired percent power and also to select an rpm/manifold pressure combination that does not exceed the maximum manifold pressure limit. I shudder to think of anyone ever doing this by the manual method; I'd guess each chart would take an engineer a week or more. My first computer used to take four minutes to do these calculations. It now takes a few milliseconds on my current machine. CAFE 400 scores for 1984 are shown in the smaller view for a payload of 400 lbs. |
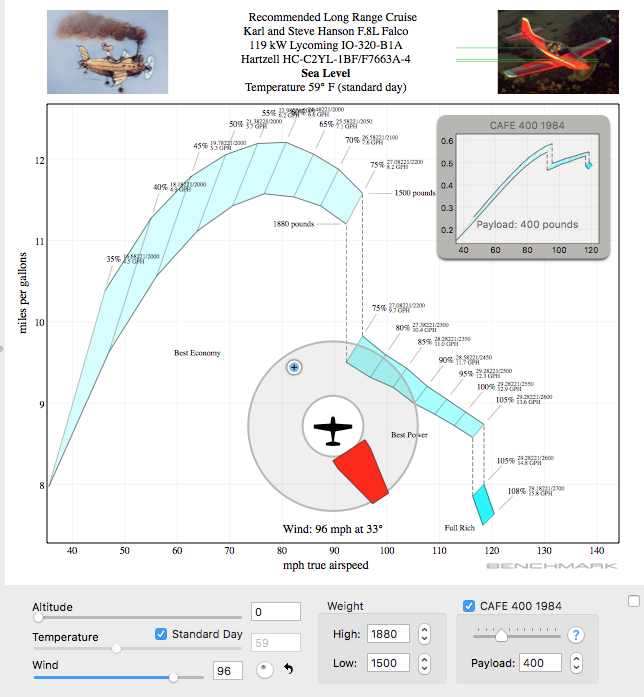
The curves change shape dramatically with changes in wind. These charts can be printed or can be saved in PDF format for editing and including in page-layout programs. And More You can use Benchmark to try different engines or propellers on your plane. There are separate files for engines and propellers. To 'install' an engine or propeller, you just drag-and-drop it into the airplane file. It's certainly much easier than trying the real thing! I'm particularly fond of a four-engine Falco with five-bladed propellers. I've only touched on the basics in this article, indeed the Benchmark 1.0 manual is 100 pages long and contains an appendix filled with equations and explanations for those who want to follow along on the math. I wrote this program for our Falco builders. Benchmark 1.0 was introduced in 1990 and ran on the early Mac Plus machines. Matt Emerson and I began work on Benchmark 2.0 in 2006 as a modern Cocoa application and over the following years have added many features that you see here. In June 2017 we have introduced Benchmark 3.0 into the Apple App store. Benchmark is the only program of its type in the world, and it has involved an enormous amount of work. It runs only on an Apple Macintosh. If you find this capability interesting, please find a friend who has a Mac and use it on their machine—-after all, Benchmark is not a program you need to use every day. |
|
|
![]()