Performance Testing 101
![]()
Performance Testing 101 |
|
The Engine The best way to do this is to use a torquemeter. This is an extremely expensive gizmo that you bolt between the engine and propeller. It's really nothing more than a propeller extension with a bunch of strain gauges that measure the torque and then sends this information to a cockpit data recorder. With such a device, you can get precise data about the power that the engine actually puts out when installed in your plane. This really isn't a practical solution for an individual. For us, the best solution is to use the sea level and altitude performance charts published by engine manufacturers. The sea level part of the chart is an engine-specific chart normally derived from a dynamometer (or torquemeter data), while the altitude part is an industry-standard, physics-based projection of that data. |
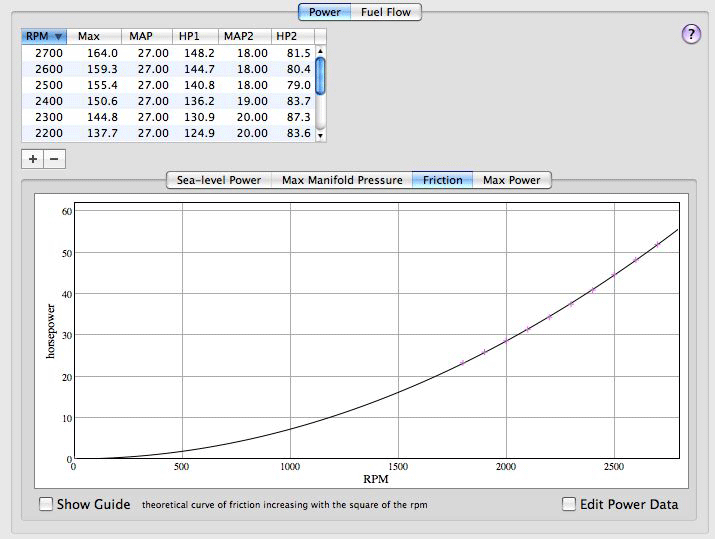
Curve-fitting the maximum engine horsepower vs rpm One of Jim Petty's major accomplishments was to reduce this charting method to an equation. The Petty Engine Power Equation has been reviewed by a number of powerplant engineers and all agree that it duplicates the sea level and altitude performance chart method. The equation is a real beaut, and I'll spare you the sight of the gruesome thing. (If you're interested in the equation, see the May 1988 Light Plane Maintenance, "Percent Power, Wherein Alfred P. Scott and James S. Petty Wrestle a Giant Man-Eating Polynomial to the Ground" by Kas Thomas.) To calculate engine power, Benchmark needs to know about three curves for the engine: friction horsepower, maximum horsepower and maximum manifold pressure—all for sea level. For those of you without a torquemeter, you get this data by looking up points on the engine manufacturer's sea level performance chart. Benchmark then goes through the usual curve-fitting for each of the curves. |
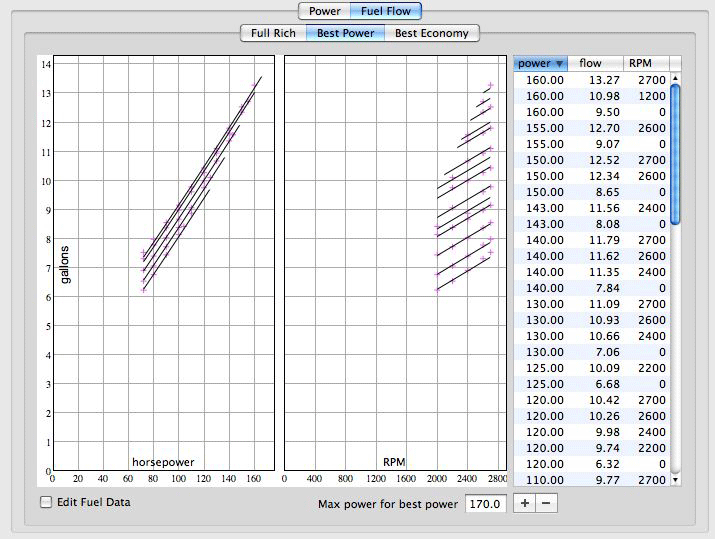
Curve-fitting the fuel flow of the engine. This is a three-dimensional Fuel flow, in gallons-per-hour, is a function of horsepower and rpm. You get this data from the published charts supplied by engine manufacturers (or from flight data), enter it in Benchmark and go through a curve-fitting process—only this time the curve is a three-dimensional shape. But Benchmark will fight bravely with your data and in the end you can get a curve that will easily model the fuel flow of the engine for three conditions: full rich, best power and best economy. |
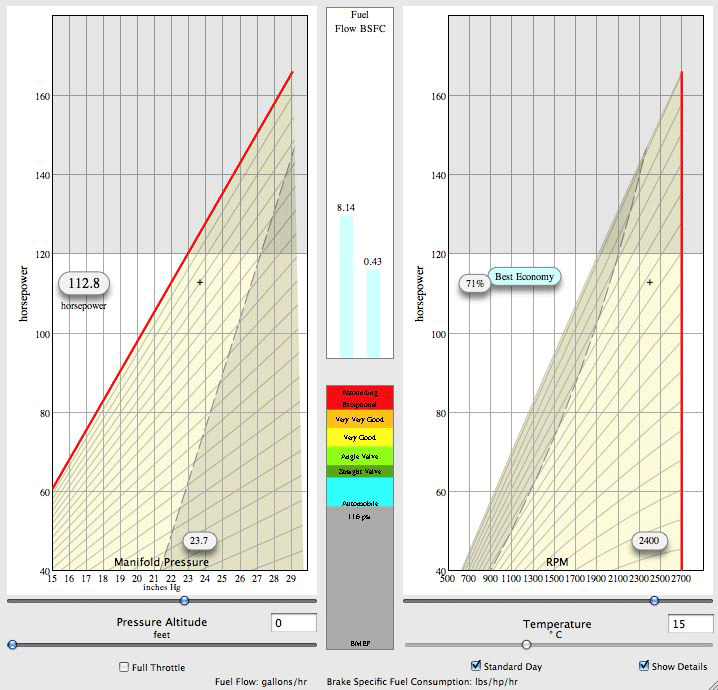
The engine power calculator There's an engine power calculator in Benchmark, so you can 'run the engine' at various power settings, altitudes and temperatures and immediately calculate the engine horsepower, BMEP, fuel consumption and brake specific fuel consumption. You can also chart specific fuel consumption vs RPM. The Airplane The Pitot-Static System This is done with a flight test on a day where there is no wind and you have smooth air. You fly the airplane at various airspeeds and record the indicated airspeed and the ground speed. There are several methods that can be used. The method used at Mooney and many other aircraft companies is the theodolite method. In this case, a surveyor's instrument was connected to a data recorder. The aircraft was flown down the center of the runway and an engineer would track the airplane by keeping the crosshairs of the instrument on a spot on the airplane. The data recorder would spew forth volumes of data on the azimuth and elevation of the instrument at fixed-time intervals. From a plot of this data, they could determine, by the rate of swing of the instrument, when the airplane was perpendicular to the instrument and thus the airplane's speed. One run is made for each speed. As you might imagine, this method is very accurate, but it's expensive and difficult. For the rest of us, a better solution is to establish a measured speed course of about two miles length with obvious markers at each end of the course. Fly the course and time the runs. Benchmark has a calculator to convert the data to the required indicated vs calibrated airspeeds. This is entered into Benchmark and then you fit yet another curve to the data, just like an instrument. The advent of GPS systems, though, may provide an even better method since a GPS system can record ground speed with great precision. Induction System Ram Recovery The ram recovery flight test is the simplest of all. You just fly the airplane at full throttle, write down the pressure altitude, indicated airspeed, engine rpm and indicated manifold pressure. Enter this into Benchmark, and it will calculate the ram recovery. Karl Hansen's Falco gets about 85%, but that is without an induction filter. |
![]()