Benchmark
![]()
Benchmark |
|
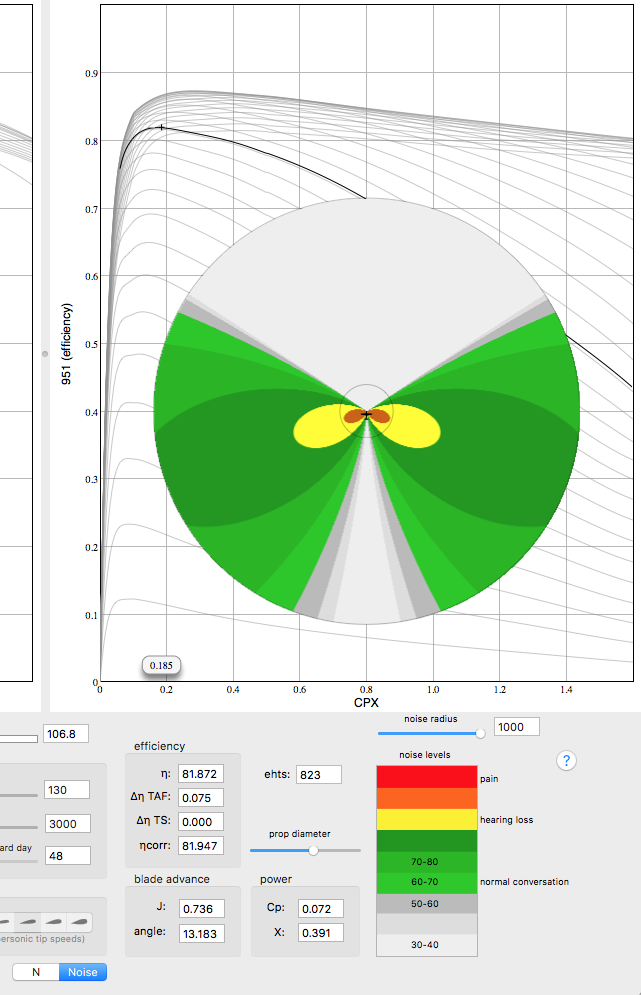
And if you want even more details, you can stretch the window wider to reveal all the numbers that are used the the calculations. The prop diameter slider allows you to experiment with the size of the propeller and note the effect on propeller noise. We have added the propeller noise capabilities at the request of Brien Seeley at the CAFE Foundation, and now at the Sustainable Aviation Foundation, Inc. On the Power side of the chart, we've added a noise footprint, where the noise level is calculated according to the modified Gutin noise formula described in NACA Technical Note No. 1145. In the graphic, you're looking at the airplane from directly above, with the front of the airplane at 12:00. Pale green starts at 60 dBA and the graduations step up in 10 dBA increments. Thus the pale green band is for 60-70 dBA, the noise level of normal conversation at 3 to 5 feet. Yellow is for 90 dBA, the noise level that will cause hearing damage when you're exposed to it over an extended period of time. Red is for 125 dBA, the onset of pain. In the graphic above, the outer circle is for a 1000-ft radius, while the smaller circle is for a 125-foot radius. You can use the slider to zoom in on the 125' radius circle. In the interest of full disclosure and so that we are not castigated for over-representing the prop noise capability in Benchmark, please note that the Gutin noise formula dates from the 1940's and we are including this only as one way of calculating the prop noise. The prop noise experts we have talked to emphasize the limitations of this method, and they say that the Gutin Formula's shortcoming was that it under-estimates total noise because it did not account for unsteady noise, with unsteady noise being all the variables due to the afterbody shape and the fluctuations in wind, gusts, angle of attack and blade flex/whip. We have attempted to include more accurate models into Benchmark but it does not appear to be a something that will work in Benchmark. |
![]()
![]()
|
|